

Find your dream home
Search by Location
|
Search by Drive Time™
search near me
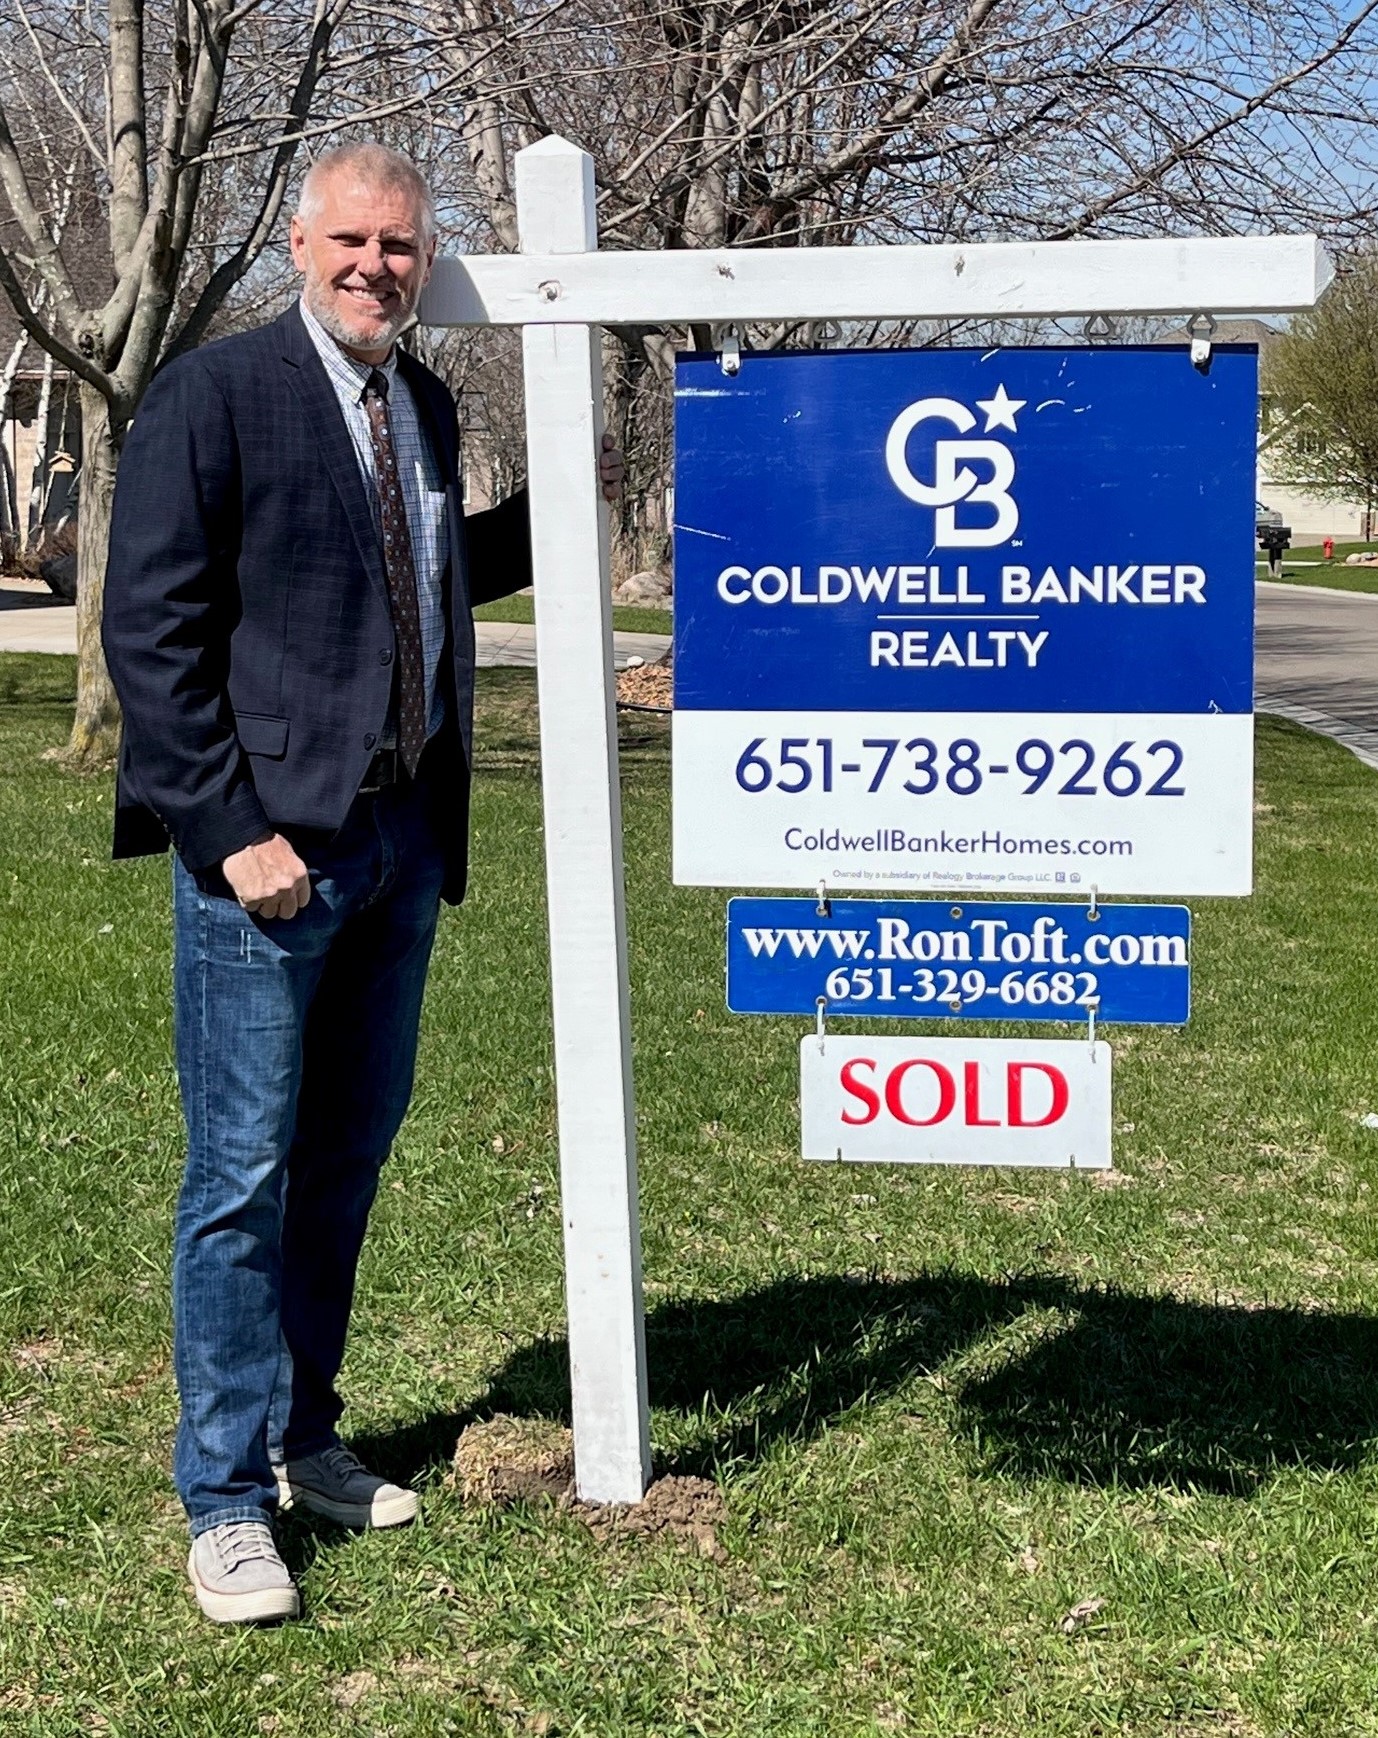
Ron Toft
Full-Time Real Estate Advocate since 1992
Business Philosophy | Many agents think their most important job is satisfying the customer ... I don't think that's true. I believe that satisfying the customer is simply the minimum requirement for staying in business. As a CRS (<4% of Realtors) with 30+ years of experience and 500+ home sales, I work constantly to improve my systems, processes and services to go well beyond the standard level of "service" provided by most agents. This is accomplished through the collaborative efforts of the many members of my team who are dedicated to the success of your individual housing transaction(s).
